
01
Model
Differentiated 3T3-L1 adipocytes → conditioned medium → RAW264.7 macrophages

The Science of Preservation
Because it is a material added to the face,
we also consider cell response
and effects on the surrounding environment.
For Preface, the design of the material was examined,
and inflammation-related responses after exposure
to the material were studied in an in vitro cell study.
This page presents three kinds of material separately.
They are related literature, the product design of Preface
and the in vitro cell study of Preface.
For each, the subjects, conditions
and scope of interpretation are stated.
Literature 01 · Human Imaging Study
In 20 patients prescribed a weight-loss medication,
the average weight loss was about 11 kg.
When facial images from before and after the prescription
were compared, midface volume had decreased
by a median of about 9%.
The decrease was about 11% in the superficial fat compartments
and about 7% in the deep compartments,
and the decrease in the deep compartments was less consistent [1].
Change in facial volume before and after weight loss
Human observational study · 20 patients · mean weight loss of approx. 11 kg · comparison of CT and MR images before and after a prescribed weight-loss medication
Literature 02 · Facial Anatomy
Beneath the skin, superficial fat, deep fat
and the structures that support them form layers.
The size and position of each layer, and the way the layers
fit together, are involved in the shape of the face.
The outermost layer of the face.
Its thickness and elasticity, and the condition of the layers
beneath it, are involved in the shape seen from the outside.
The fat layer directly beneath the skin.
The amount and distribution of superficial fat
are involved in the shape of the face.
The structure of the septa that divide the compartments
differs by region.
In one observational study, this was the layer
that had decreased more after weight loss [1].
The layer that creates depth and projection.
It differs from the superficial layer in both position and role.
Fascia, retaining ligaments and the skeleton form
the framework that sets the position of the layers.
Literature 03 · Adipose Tissue
One study looked directly at adipose tissue
after weight loss in humans.
In 25 people with obesity, abdominal subcutaneous fat
was compared before bariatric surgery and after weight loss.
Stress- and senescence-related signals in adipocytes,
precursor cells and vascular cells had decreased.
Macrophage infiltration had also decreased, but the activation
state of the macrophages had not fully reverted.
In this study, adipose tissue after weight loss had changed
in the state of its cells as well as in its amount [2].
A mouse study observed adipose tissue during weight loss.
When food intake was reduced in mice with induced obesity,
the proportion of macrophages in subcutaneous adipose tissue
rose from about 10% to 20% on the third day,
and that time point coincided with the time
when lipolysis was most active.
The incoming macrophages took up the released lipids,
and the authors interpreted this as a buffering role [3].
In another study in mice and cultured adipocytes,
inducing lipolysis by receptor stimulation raised
the expression of an inflammatory signal (IL-6) in adipocytes [4].
When a mouse adipocyte cell line and a macrophage cell line
were cultured together, inflammatory signals (such as TNF-α)
increased markedly, and the authors proposed a loop
in which free fatty acids from adipocytes and inflammatory
signals from macrophages amplify each other [5,6].
In cultured-cell studies, such inflammatory signals
increased lipolysis and decreased fat storage
and the differentiation of preadipocytes [7–10].
When human adipocytes were given macrophage-conditioned medium
and only the IL-1β in it was neutralized,
the increased lipolysis and the reduced insulin signaling
were reversed to a considerable extent [11].
Even with the same signal, results differed with the state
of the cells and the duration of exposure.
IL-1β briefly supported the differentiation of early
precursor cells, but as exposure continued, that effect
disappeared and only the inflammatory response remained [12].
Signal feedback triggered by lipolysis
Observations in rodents and cultured cells [3–11]
Literature 04 · Hyaluronic Acid & ECM
Hyaluronic acid in the body has been studied
in the space between tissues, in the coat immediately
around cells, and at contact points on the cell surface.
The studies below address these three locations.
There are also studies on hyaluronic acid
and matrix stiffness in adipose tissue.
When hyaluronic acid was enzymatically removed
from human adipose tissue samples, the expression of genes
related to adipogenic differentiation decreased,
and the differentiation of mouse-derived
cultured adipocytes was also suppressed [17].
On an experimental gel substrate as soft as adipose tissue
(a polyacrylamide gel coated with adipose tissue
extracellular matrix; not hyaluronic acid),
human adipose-derived stem cells kept a rounded shape
and headed toward becoming adipocytes.
When the substrate was stiffer, the cells
spread widely and lost that direction [18].
Human preadipocytes cultured on an esterified
hyaluronic acid scaffold differentiated into adipocytes [19],
and when a hyaluronic acid gel was injected
together with human adipose-derived stem cells
under the skin of immunodeficient mice,
new adipose tissue was observed after 8 weeks [20].
Product Design
The following are the design indicators measured for Preface
and the results of its in vitro cell study.
MoD and CrR are used to describe the chemical structure
of cross-linked hyaluronic acid.
Cross-linked hyaluronic acid is made
by linking chains with a crosslinker.
MoD is the amount of crosslinker bound to the chains.
CrR is the share of bound crosslinker
attached to the chains at both ends.
Crosslinker attached at only one end does not form
the network and remains as a pendant residue.
The definitions of the two indicators and the NMR
measurement method follow the literature [24,25].
The measured values for Preface are
MoD about 1.4% (1H NMR) and CrR about 0.22 [28].
Among the 13 commercial cross-linked hyaluronic acid products
analyzed in the literature, the product with the highest MoD
had MoD about 17% and CrR about 0.09 [26].
The Preface values were not measured together
in that publication, so the comparison is for reference only.
There is no officially recognized reference value for CrR.
The two paragraphs below cover general literature
that did not test Preface, and an internal exploratory analysis.
There are cell studies on the purity
and chemical modification of hyaluronic acid.
In a test with mouse immune cells, purified
pharmaceutical-grade hyaluronic acid did not raise
inflammatory signals, and endotoxin contamination
was confirmed in the reagents that caused a response
(1 hyaluronic acid derived from human
umbilical cord and 2 hyaluronidases) [21].
Hyaluronic acid whose modification level was raised
from about 10% to 40% showed about 57% less binding
to the receptor CD44 in a solution-state test
(based on the modification type with the largest change) [22].
In a test in which human macrophages were cultured
in collagen gels, hyaluronic acid that was not immobilized
in the gel lowered inflammatory markers.
When hyaluronic acid was chemically immobilized
in the gel, this decrease was not seen [23].
All three studies dealt with experimental
hyaluronic acid materials, not with Preface.
There is also an animal study on the degree
of cross-linking and tissue response.
When hyaluronic acid formulations with a lower
and a higher degree of cross-linking were administered
to immunologically pre-sensitized guinea pigs,
inflammatory cell infiltration was lower with the lower one.
The two formulations differed in physical properties
as well as in degree of cross-linking [27].
This is not a study of Preface.
An internal exploratory analysis [28] looked at
the structural indicators of 12 products (including
published values from the literature [26])
together with in vitro study values.
Expression of inflammatory signals tended to be higher
with a higher degree of modification (MoD) and lower
with a higher effective crosslinker ratio (CrR) [28].
This is an exploratory analysis of trends,
and structural indicators alone cannot predict
the response of an individual product.
The methods and results of the in vitro
cell study of Preface follow.
Amount of crosslinker and share bound at both ends
Preface [28] (measurement method [24,25]) · compared with a commercial product in the literature [26]
Attached at one end · remains as a pendant residue
Attached at both ends · forms the network
Degree of modification (MoD)
1H NMR · Lower means less crosslinker attached to the chains
Effective crosslinker ratio (CrR)
Higher means more of the attached crosslinker is bound into the network
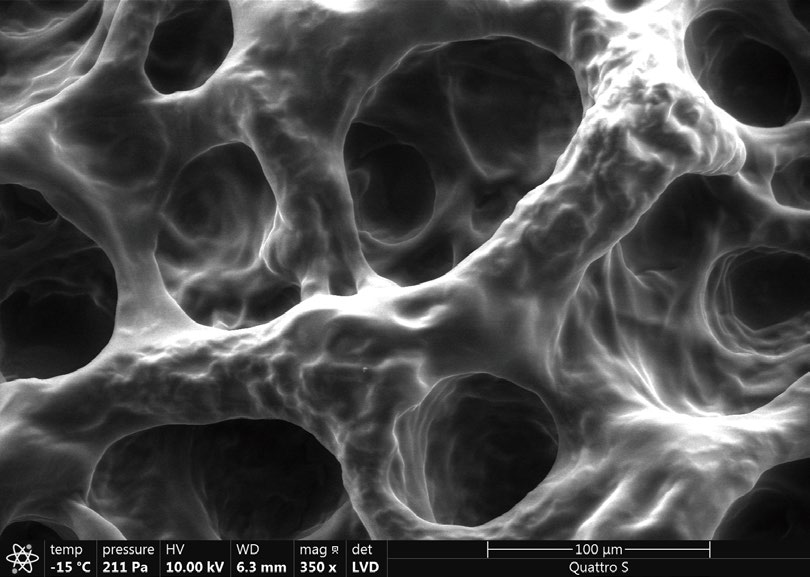
Rheological properties of Preface
Frequency sweep · 1 Hz · In-house test
| Storage modulus G′ | 260.6 Pa |
|---|---|
| Loss modulus G″ | 107.5 Pa |
| tan δ (G″ ÷ G′) | 0.41 |
| Complex viscosity η* | 44,870 cP |
Product · In Vitro Study
In an in vitro cell study using adipocytes and macrophages,
expression of inflammation-related genes was evaluated according to
the order of the lipolytic stimulus and product exposure.
01
Differentiated 3T3-L1 adipocytes → conditioned medium → RAW264.7 macrophages
02
IL-1α · IL-1β · IL-6 · TNF-α mRNA
03
2 orders (treatment after stimulus · treatment before stimulus) × 3 combinations of cell and time point × 4 mRNAs = 24 endpoints.
In the after-stimulus order, adipocytes receive the stimulus for 4 hours and then the extract for 24 hours.
In the before-stimulus order, the extract is applied first for 24 hours and removed, then the stimulus is given and the cells are cultured for 24 more hours.
In both orders, the adipocyte culture medium is transferred to macrophages and read after 2 hours and 24 hours.
All 24 observed values for Preface were lower
than the stimulus-only control (=1) (0.01–0.93).
The values for the six other material families were numerically
higher than those of Preface at all 24 endpoints [28].
Of the six families, Cross-linked HA was tested
in a separate run of the same method.
The median fold is the median of the fold values relative
to Preface calculated for each of the 24 endpoints.
Other material families — relative to Preface
In vitro study · median fold across 24 endpoints
The Cross-linked HA values (a cross-linked HA product with a high degree of modification) come from a separate run of the same method and were numerically higher than Preface at all 24 corresponding endpoints. Because the run was different, these values were not obtained side by side with the other five families, and no statistical tests are included in this material.
| Material family | Median fold | Endpoints higher than Preface |
|---|---|---|
| PN + HA | 7.0× | 24 / 24 |
| PLLA | 7.4× | 24 / 24 |
| Human-derived extracellular matrix | 8.6× | 24 / 24 |
| PCL | 11.1× | 24 / 24 |
| PDLLA + HA | 11.1× | 24 / 24 |
| Cross-linked HA (separate run) | 23.0× | 24 / 24 |
Expression of inflammation-related genes by test condition — Preface observed values (stimulus only = 1)
4 inflammatory signals (mRNA) × 6 conditions = 24 observed values
| After stimulusmacrophages 2h | After stimulusmacrophages 24h | After stimulusadipocytes 24h | Before stimulusmacrophages 2h | Before stimulusmacrophages 24h | Before stimulusadipocytes 24h | |
|---|---|---|---|---|---|---|
| IL-1α | 0.93 | 0.39 | 0.37 | 0.22 | 0.08 | 0.87 |
| IL-1β | 0.04 | 0.30 | 0.14 | 0.25 | 0.12 | 0.11 |
| IL-6 | 0.09 | 0.28 | 0.07 | 0.24 | 0.08 | 0.09 |
| TNF-α | 0.01 | 0.34 | 0.08 | 0.25 | 0.07 | 0.18 |
References
‘View source’ for each reference links to the original publication (DOI). No. 28 is an internal study report that directly evaluated Preface, and it has no public link.